The following visualisation shows long-term commodity price indexes across various food items since 1850, relative to real prices in the year 1900 (i.e. prices in 1900 = 100).
Long-term comparison of US manufacturing wages and food prices
The following visualisations show the relative difference in average USA manufacturing wages relative to the price of food commodities based on Bureau of Labor Statistics data.2
I.2 Food prices in the recent past
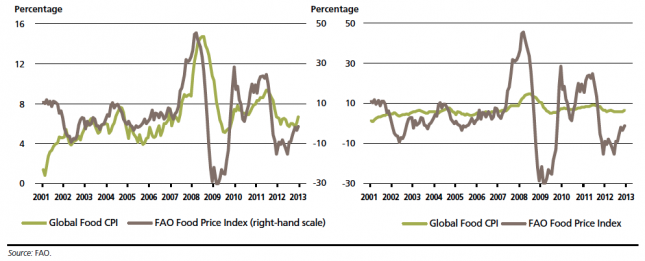
The FAO Food Price Index (FPI) is a measure of the international prices of food (e.g., between suppliers or nations), while the food consumer price index (CPI) is a measure of the price of food to the actual consumer. The following graphs show that "the FPI translate to higher consumer prices only to a very limited degree and with a time lag of a few months." The lag is often due to the time needed to harvest, transport and process food to the consumer. The limited relationship in the magnitude of the two indices "is explained by a combination of factors that determine vertical price transmission in every food economy, including mark-ups for transportation, processing and marketing, and by any subsidies at the consumer level."3
Global food consumer price index (CPI) & FAO food price index (right-hand scale), 2001-2013 – FAO (2013)4
I.3 Food Price Volatility
Consequences of High Food Price Volatility
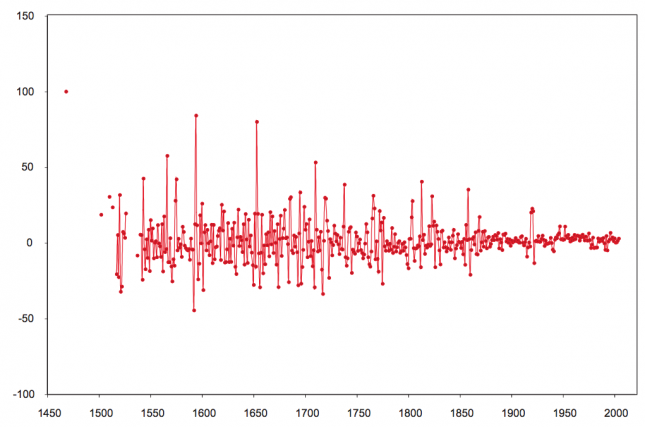
The volatility of food prices matters especially for the wellbeing of poorer people since the price increases can translate into shortages of food supply at low income levels. The following visualisations show the declining volatility over the very long-run in various locations. Especially important for this decline was the increasing integration into larger markets so that poor harvests in one area can be compensated by importing food from regions less affected by worse harvests.
Volatility of real wages of laborers in Stockholm/Sweden, 1468–2004, measured as the percentage year-on-year change in real wages – Söderberg (2010)5
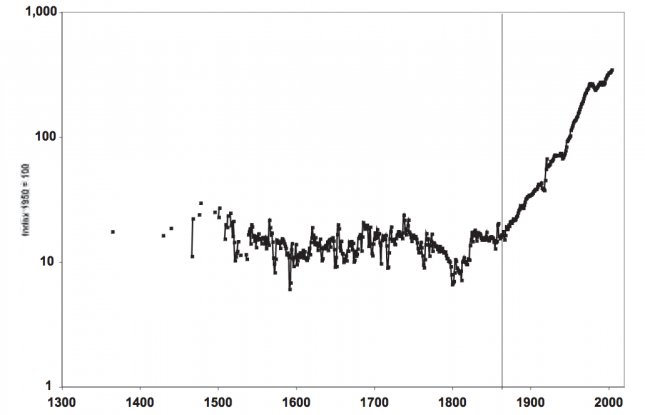
Real wages of unskilled laborers in Stockholm, 1365-1864, and industrial workers in Sweden, 1865–2004 (index 1950=100) – Söderberg (2010)6
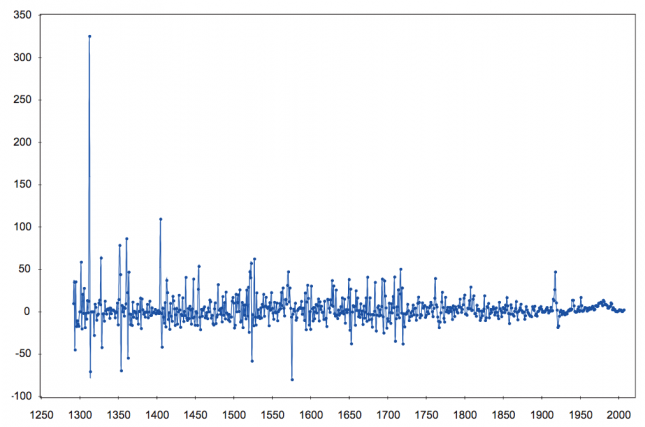
Volatility of the deflator consumer price index (CPI), 1291-2004, measured as the percentage year-on-year change in the CPI – Söderberg (2010)7
Volatility in real wages and in the deflator consumer price index (CPI), 1291–2004, measured as the standard deviation of the percentage year-on-year change – Söderberg (2010)8
Period
Volatility of real wages
Volatility of deflator CPI
1291 - 1399
38.1
1400 - 99
17.8
1500 - 99
20
19.2
1600 - 99
16.4
14.7
1700 - 99
13.3
12.6
1800 - 99
9.5
6.9
1900 - 2004
4.7
7
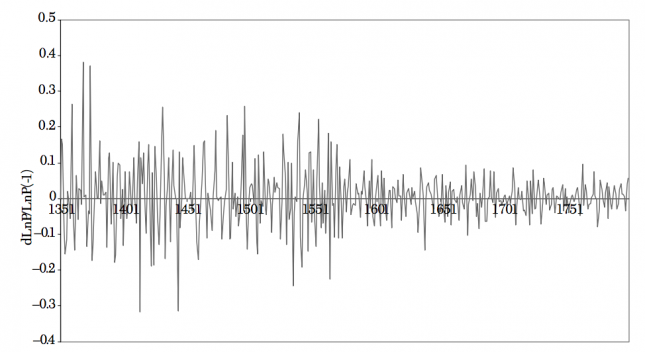
Long Run Evidence of the Decrease of Volatility
Year-to-year variation in the price of wheat in pisa, 1351-1799 – Ó Gráda9
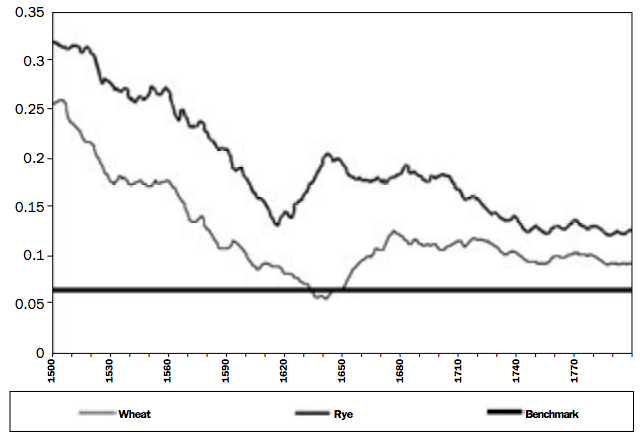
Coefficients of variation for wheat and rye combined - market integration in the North and Baltic Seas, 1500-1800 – Jacks (2000)10
Recent trends in food price volatility
I.4 Consumer expenditure on food
Per capita food expenditure
In the map below we see the average per capita food expenditure across select countries, as published by the United States Department for Agriculture (USDA). Food expenditures are measured in US$.
Overall we see large differences in food expenditure across the world. The average Swiss expenditure was $3,631 in 2016 - more than 10 times higher than the average Venezuelan who spent only $258.
Food expenditure as a share of total consumer expenditure
In the chart below we see the share of total consumer expenditure spent on food across select countries in 2015. For some countries, food constitutes a large share of expenditure - Nigerians spent 59 percent of total expenditure on food. For others, food constitutes a small share - in the United States, this share was only 6 percent. This relationship is explained by a concept called 'Engel's Law' which we explore in the Correlates section of this entry.
II. Correlates, Determinants & Consequences
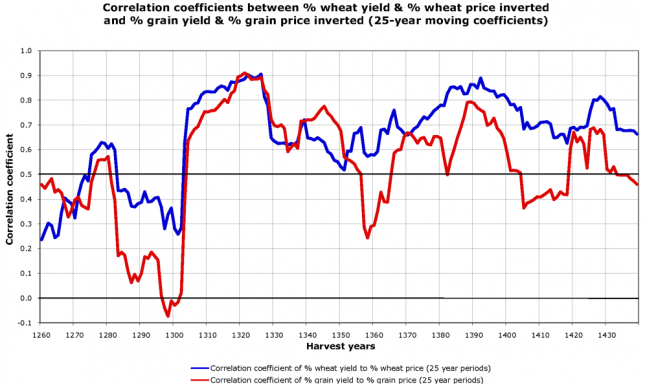
II.1 Determinants of Food Prices
Correlation coefficients between % yield and % price inverted, 1211-1491 – Campbell11
Food vs. fuel: food and energy prices
In the chart below we see the long-term global commodity price index of cereal crops (wheat and corn) alongside the oil price index since 1850. Although not perfectly matched, we see some relationship between the two: increases in oil (energy) prices tend to result in increases in cereal prices.
This relationship may be attributed to two key reasons. Firstly, most modern agricultural and food systems require energy inputs (either in the form of on-farm machinery, transportation, distribution or storage energy). Increases in energy prices can inevitably have an impact of producer and distribution costs, resulting in higher food prices. Studies have suggest that the passthrough of price changes in energy and transport inputs to agricultural commodities to result in a price increase of approximately 15-20 percent.12
The second potential reasoning for this relationship relates to the allocation of crops to biofuels - an important consideration in terms of food security. The rationale follows that a rise in oil prices drive demand in the production of biofuels; this increased diversion of food crops to biofuel production reduces food supplies, resulting in an increase in price. The role of biofuel production on food prices and food security remains strongly contested. Following the rise in food prices over the period 2005-2008, several authors - including the World Bank - attributed the largest driver to be increased biofuel production in the United States and European Union.13 The authors state that the rise in food prices " the most important factor [in higher food prices] was the large increase in biofuels production in the U.S. and the EU. Without these increases, global wheat and maize stocks would not have declined appreciably, oilseed prices would not have tripled, and price increases due to other factors, such as droughts, would have been more moderate."
Other studies which assess the relative contributions of different drivers of food prices suggest the price relationship between biofuel and food commodities is more complex. Zilberman et al. (2012) conclude that the introduction of biofuels can affect food prices but this impact various significantly by crop type and location; this effect is less marked when biofuel production is not competing for natural resources with food crops.14 For example, the use of sugarcane ethanol in Brazil or use of non-food crop biofuels (such as miscanthus grasses) are likely to have a smaller impact on food prices relative to cereals such as wheat or corn. The authors also note that the impact of biofuels on food prices can be significant, but less so than other drivers such as economic growth, or the introduction of genetically-modified crops (which have the opposite effect on prices).
II.2 Determinants of Food Price Volatility
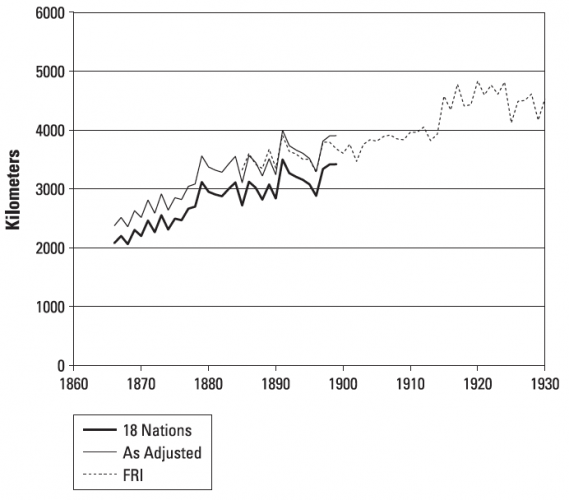
Evidence of the Increase of Food Trade and the Effect of Trade on Food Price Volatility
Average distance of world wheat production from London, 1866-1930 – Olmstead & Rhode (2007)15
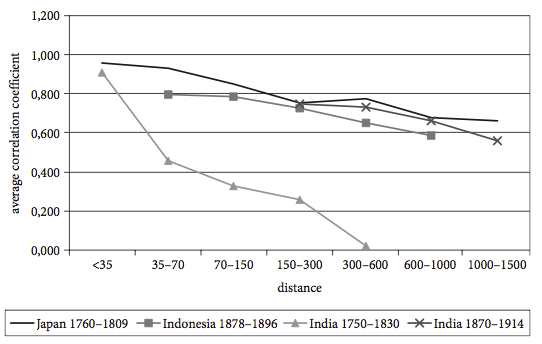
In the following graph you see two important aspects: Firstly the correlation between price correlation and distance and, secondly, how in India between 1750-1830 and 1870-1914 the agricultural market became more integreated, and the price differences between different regions were reduced.
Market integration in Japan, Indonesia and India - average correlation coefficient vs. distance, 1750-1914 – Van Zanden (2009)17
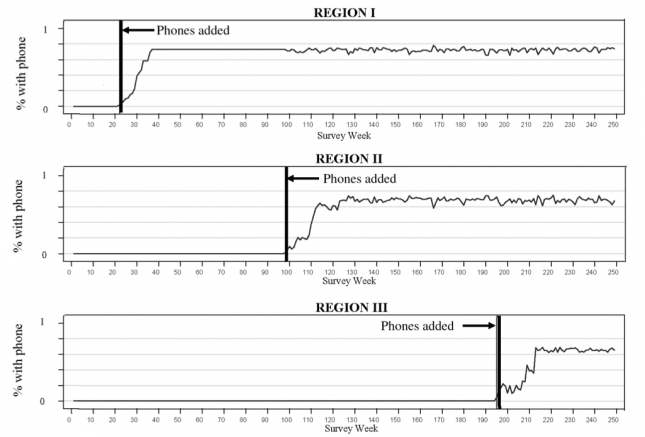
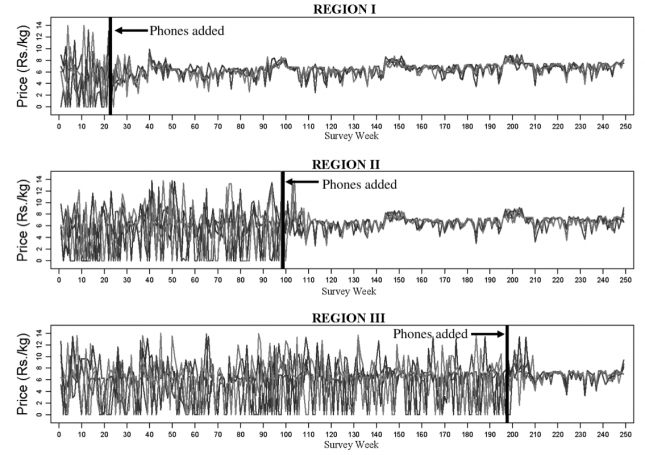
Kerala Study of the Effect of Mobile Phone Adoptions on Price Volatility - The Digital Provide
Mobile phone adoption by fishermen – Jensen (2007)18
Prices and mobile phone service in Kerala – Jensen (2007)19
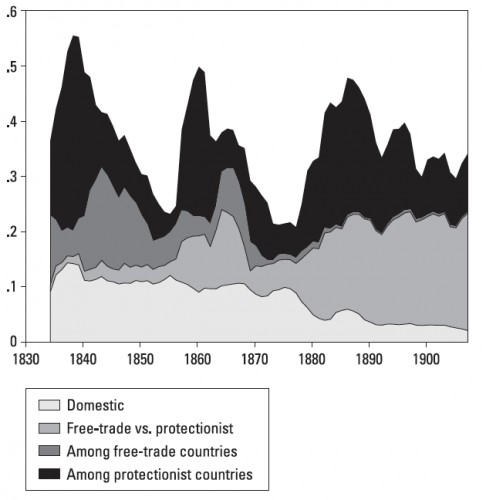
The Effect of Protectionism
Decomposition of ‘world’ price variance, 1830-1913 – Federico and Persson (2007)20
II.3 Determinants of Food Expenditure
Engel's Law
In 1857, the economist Ernest Engel wrote: "the poorer a family, the greater the proportion of its total expenditure that must be devoted to the provision of food", with later extension of this concept to national and global levels.21 This later became known as 'Engel's Law'.
'Engel's Law' states that as incomes rise, the proportion of consumer expenditure spent on food falls, even if food expenditure rises in absolute terms. We can see this relationship in the following two charts across select countries of varying income levels. In the first chart we see the relationship between the share of consumer expenditure spent on food (y-axis) versus gross domestic product (GDP) per capita. Overall we see that countries at lower incomes tend to spend a much higher percentage of expenditure on food; countries with per capita GDP below $5,000 tend to spend more than 30 percent of expenditure on food. Countries at the high end of the income scale tend to spend a much lower share: typically 10-15 percent.
LOGShare of consumer expenditure on food0%10%20%30%40%50%ChinaIndiaUnited StatesIndonesiaBrazilPakistanNigeriaJapanMexicoPhilippinesVietnamGermanyIranSouth AfricaSpainUkraineKenyaArgentinaPolandPeruSaudi ArabiaUzbekistanChileKazakhstanEcuadorGreeceTunisiaBoliviaSwedenAzerbaijanJordanCroatiaGeorgiaLithuaniaKuwaitAfricaAsiaEuropeNorth AmericaOceaniaSouth AmericaSource: World Bank WDI; USDA
Those at higher incomes tend to spend a lower share of expenditure on food - this is despite the fact that they tend to spend more on food in absolute terms. In the chart below we see total food expenditure (in US$ in 2015) on the y-axis versus GDP per capita. Here we see that as incomes rise we spend more money on food in absolute terms; the average person in Switzerland spends more than 10 times as much on food than the average Indian. However, this is despite the fact that the average Indian spends more than three times as much as a share of total expenditure, as seen in the chart above (the average Indian spends 31 percent of total expenditure on food, versus only 9 percent in Switzerland).
LOGFood expenditure per person (US$)$0$1,000$2,000$3,000$4,000ChinaIndiaUnited StatesIndonesiaNigeriaRussiaJapanPhilippinesVietnamGermanyIranSouth AfricaSouth KoreaSpainArgentinaPolandVenezuelaPeruAustraliaKazakhstanGreeceCzech RepublicSerbiaSwedenAzerbaijanUnited Arab EmiratesIsraelSwitzerlandHong KongJordanSlovakiaSingaporeNorwayIrelandUruguayQatarAfricaAsiaEuropeNorth AmericaOceaniaSouth AmericaSource: World Bank – WDI, Consumer expenditure on food - USDA (2017)
So, as incomes rise we tend to allocate a smaller share of total expenditure on food (and spend it instead on other goods and services) despite spending more on food in absolute terms (as seen in the chart below).
III. Data Quality & Definition
III.1 FAO Food Price Index
“The FAO Food Price Index is a measure of the monthly change in international prices of a basket of food commodities. It consists of the average of five commodity group price indices [cereal, vegetable, dairy, meat and sugar], weighted with the average export shares."22
IV. Data Sources
IV.1 Historical Statistics on Food Prices
Food Price Data by David Jacks
Data: David Jacks an expert in agricultural history publishes many food price series on his website.
Geographical coverage: Many countries and regions around the world
Time span: Some of the series go back to the Middle Ages but most start after 1800.
Geographical coverage: Different places in England
Time span: 1270-1955
Available at: The website of the International Institute of Social History here.
IV.2 Data on Food Prices in Recent Decades
FAO – Food and agricultural price statistics
Data: Food prices of over 200 commodities for primary crops, live animals and livestock – “representing over 97 percent of the world’s value of gross agricultural production” (FAO). Producer prices and producer and consumer price indices.
Geographical coverage: Over 130 countries.
Time span: The up-to-now series go back to 1991, whilst the Price Archive contains historical data from 1966 to 1990 (these series are not always comparable). Monthly and annual data.
Available at: The FAO Food and Agricultural Price Statistics are online here.
